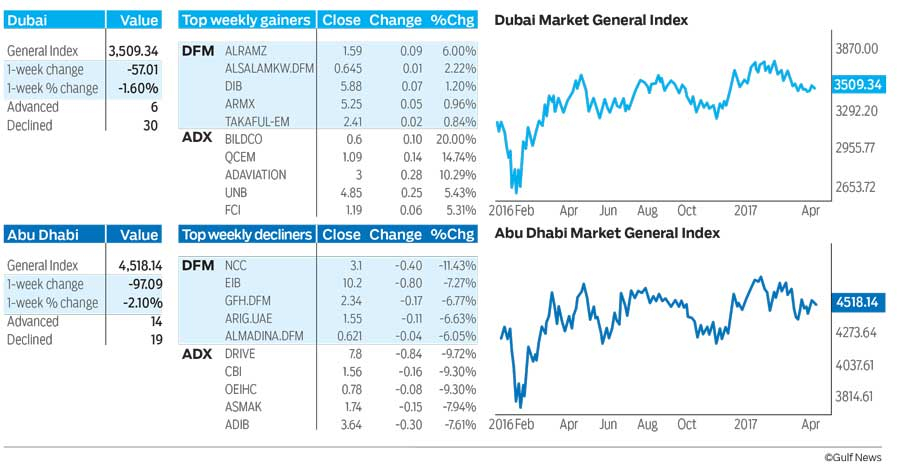
Dubai: The Dubai Financial Market General Index (DFMGI) dropped by 57.01 or 1.6 per cent last week to close at 3,509.34. Most issues fell as there were 30 declining against only six advancing, while volume was more than a quarter less than the prior week.
It’s not clear what might be coming next. There are both short-term bullish and bearish signs. Regardless, last week’s high and low can be used to help determine the next short-term direction.
If we step back a bit and look at the past year of activity we will see that the DFMGI has been in a relatively wide ranging consolidation pattern. Near the beginning of the this year the index broke out to the upside from the initial consolidation phase, but before going much higher it fell back into the range of the original pattern where it has remained since early-March.
Last week’s performance was disapointing, particularly since it followed a strong week prior (biggest gain in five weeks), which gave some hope to the bulls that the buying strength seen would have some legs. It can be labeled as an inside week as the high-to-low range was contained within the range of the prior week. In other words, last week’s high did not breakout above the prior week’s high, which would have shown some continuation of strength.
The index is still flirting with potential support of its long-term uptrend line. A month ago the DFMGI dropped below the line briefly, before rallying back to close above it two weeks ago. Last week’s close puts the index back below the line. By itself a bearish sign. When there is a decisive break below an uptrend line, as in this case, it provides one piece of evidence of a market hampered by selling pressure.
A daily close below last week’s low of 3,505.64 provides a short-term bearish signal with the index then heading for the two-week low of 3,470.36. The more critical potential support area is around 3,435.14. That low completed the most recent 8.1 per cent seven-week correction. A daily close below it points to further downside.
Since last week’s high of 3,571.06 is so close to the two-week high of 3,573.25, a breakout above the higher price level should be used to provide the next bullish signal. A daily close above it confirms a continuation of the three-week uptrend, with the index then heading towards a 3,604 to 3,624 resistance zone. If it gets above there it will be heading towards 3,655.
Abu Dhabi
Last week the Abu Dhabi Securities Exchange General Index (ADI) declined by 97.09 or 2.10 per cent to close at 4,518.14. Market breadth leaned on the bearish side but not by much. There were 14 advancing issues and 19 declining. Volume improved slightly above the prior week, reaching a six-week high.
The most recent swing high resistance was at 4,655.81 from two weeks ago. That was a little below the prior swing highs from five weeks. Therefore, there remains a series of lower swing highs and lower swing lows within a 12-week descending trend channel structure.
Countering that descending pattern is the long-term uptrend line that represents support near the lows of the channel. During four of the past five weeks that line is where support was seen. It can therefore be expected to identify support again in the future and there is some significance if the ADI closes below it.
If we draw a downtrend line from the top of the channel at 4,715.05 it will cross the uptrend line. Recent price action is now contained between these two lines. This means that price will break through one of the lines within a maximum of six weeks and very likely within three weeks. Which line it breaks through will identify the next direction for the ADI.
At this point a bullish upside breakout is triggered on a daily close above 4,655.81, with the subsequent target at the 2017 high of 4,715.05.
A daily close below the four-week low of 4,399.76 puts the ADI below its long-term uptrend line on a daily closing basis. The next key support zone is then around the recent swing low of 4,355.26.
Stocks to watch
National Central Cooling was flat last week, closing at 1.95. Two weeks ago it began to breakout above the downtrend line marking resistance of the trend coming off the November 2016 peak of 2.22. So far following that breakout the stock has not advanced by much. But it is holding strong as the wider market pulls back.
The stock has been in a retracement and consolidation since hitting the November peak, which stalled a 10-month advance. Support has been relatively consistent during the retracement, coming in around the the 21-week exponential moving average.
Another bullish trigger will occur on a daily close above the 11-week high of 2.00, last week’s high. The next price level to watch for short-term resistance is around 2.06. If National Central continues from there then the 2.22 high has a chance of being exceeded eventually.
A drop below last week’s low will indicate short-term weakness and is followed by the next support area around 1.86. If there is a daily close below the ower price level then the above bullish pattern is likely evolving into further consolidation.
Bruce Powers, CMT, is chief technical analyst at www.MarketsToday.net. He is based in Dubai.