Dubai
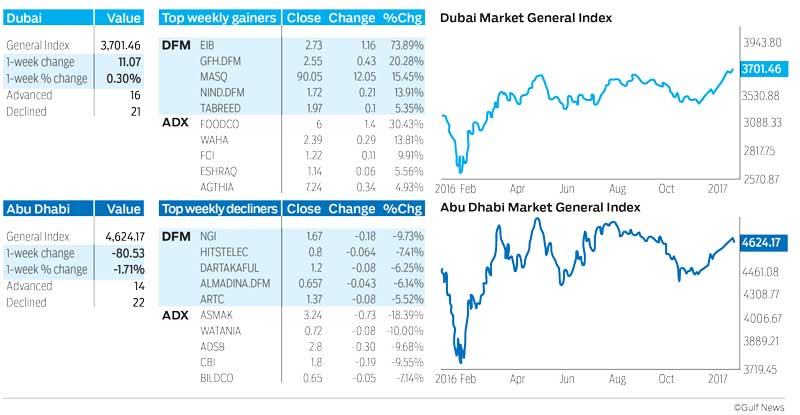
The Dubai Financial Market General Index (DFMGI) was up only 11.07 or 0.30 per cent last week to close at 3,701.46. There were 16 advancing issues and 21 declining while volume increased slightly over the prior week.
Three weeks ago the index broke out of a large rectangle consolidation pattern to a new trend high. Since then it has been pushing up against resistance with a high of 3,738.28 and it has formed a potential double top trend reversal pattern. Given the overall positioning of this pattern, if triggered, it would give a relatively short-term bearish signal, versus the larger bullish signal indicated by the upside breakout of the rectangle.
A bearish trigger is signalled on a daily close below 3,648.32. If that occurs then the next price area to watch for support would be around the 55-day exponential moving average (ema) at 3,561, followed by a price range from around 3,518 to 3,490.66.
Support last week was seen at the 3,642.62 low, right around the 21-day ema which is at 3,659. If that support area continues to hold then we will likely see further relatively sideways price action or a breakout into new highs. If an upside breakout occurs then the DFMGI would first be heading towards the 3,912 to 3,993 resistance zone, followed by a range from approximately 4,253 to 4,323.69.
Overall the outlook for the DFMGI has improved this year but nothing goes straight up. The short-term uptrend has gone on for 10 weeks and its not too surprising to see it pause before it’s ready to proceed with its ascent.
Abu Dhabi
Last week the Abu Dhabi Securities Exchange General Index (ADI) dropped by 80.53 or 1.71 per cent to end at 4,624.17. There were 14 advancing issues and 22 declining, while volume spiked to a one-year high.
The ADI pulled back last week off its new trend high of 4,714 reached two weeks ago. Weekly support of 4,597.50 from three weeks ago was tested on Thursday with the week’s low being 4,595.96. It’s not clear yet whether the ADI will fall further or not, but it certainly could before it’s ready to move higher.
Very high relative volume in a decline such as was seen last week is generally not a bullish sign. Potential support areas to watch include the 61.8 per cent Fibonacci retracement of the five-week uptrend at 4,542.60 followed by the 38.2 per cent Fibonacci retracement at 4,606.94.
Given the larger bullish pattern in the ADI the odds continue to favour an eventual upside breakout. Three weeks ago the ADI broke out of a multi month range bound phase and closed above that consolidation on a weekly basis, twice. This marked a continuation of the uptrend that began off the January 2016 lows and gave the clearest sign to date that the long-term downtrend is turning into an uptrend.
A daily close above the 4,714 high will trigger a new bullish trend continuation signal, with the index then heading to a potential resistance zone from around 4,896.89 to 4,902.09.
Stocks to watch
Emaar Properties broke out to a new 52-week high on December 12 before smacking into resistance at 7.79. This led to a two-week retracement of the prior rally into the end of the year. Emaar eventually found support 7.01, the most recent swing low. That’s right at support of the 55-day ema. This tells us that if the overall trend continues higher, which it looks like it will, the 55-day ema can be used in the future for identifying potential support during pull backs.
The current intermediate-term uptrend started at the 4.22 low reached a year ago in January. At the 7.79 high from last month Emaar had advanced 84.6 per cent off that low. After the initial rapid rally off the January 2016 low Emaar began to form an ascending trend channel with higher swing highs and higher swing low. This is a little different than what we see in the market indices, as they moved into a sideways channel for much of last year.
December’s high was the most recent swing high and the bounce off 7.01 the most recent swing low. However, that swing low is at a higher angle relative to the swing low before it, which occurred in November. This indicates that upward momentum in price is accelerating. If this stronger momentum continues then Emaar should be close to breaking out to new highs.
The first sign of strength is on a decisive rally above the three-week high of 7.68, with the more critical price level being the 7.79 peak. A bullish breakout and trend continuation will be confirmed once there is a daily close above the higher price. For this week the higher angle trend will be maintained unless there is a clear drop below last week’s low of 7.38. If that happens then first watch for support around the 55-day ema, which is now at 7.29, followed by the December swing low at 7.01.
Following an upside breakout Emaar would next be heading for a resistance zone from around the 50 per cent retracement of the long-term downtrend coming off the 2014 high at 12.00, which is at 8.11, and the April 2015 peak at 8.39.
Last week the stock ended up 0.66 per cent to close at 7.60.
Bruce Powers, CMT, is chief technical analyst at www.MarketsToday.net. He is based in Dubai.