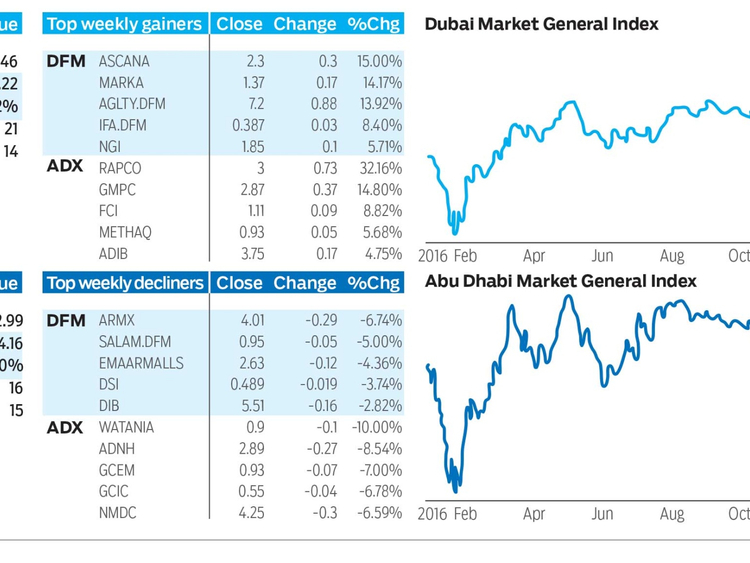
Dubai: The Dubai Financial Market General Index (DFMGI) barely moved for the week, ending down 4.22 or 0.12 per cent to close at 3,554.46. Market breadth leant on the bullish side with 21 advancing issues versus 14 declining. Even with a short four-day trading week volume remained near nine-month highs, although slightly below the prior week.
This is disappointing performance given the strong bullish breakout of a long-term rectangle consolidation pattern that occurred last Monday (first day of trading). That move put the index at a new 2016 high of 3,658.61 and it was accompanied by nine-month high volume. The day closed strong at 3,657.11, almost at the high for the day. Unfortunately, strength quickly evaporated starting the next day as profit taking dominated throughout the remainder of the week, leading to a move back to the week’s opening price by the end of the week. Last week’s close is now back inside the rectangle pattern and selling could continue into this week. Overall, this is not bullish behaviour for the near-term.
To be fair, the index started a run towards the top of the rectangle a ways down two weeks ago. So, it’s not completely surprising that it got tired as upward momentum could not be sustained once the breakout occurred. In addition, the 14-day Relative Strength Index (RSI), a measure of the strength of momentum, reached its most overbought level since the DFMGI peaked in 2014 on Monday and has since turned back down.
High volume
Indications are more short-term bearish given the high volume, close at the low of week’s range, and close inside the consolidation pattern, than they could be following a breakout. In addition, there was relatively high volume that occurred on a week where the index closed down, although not by much. That’s the highest volume on a down week in two years and is another piece of evidence to support a bearish outlook near-term.
There was a real chance for a sustainable bullish breakout last week but the signs so far are showing a potential failure. At the least the DFMGI can be anticipated to pull back further and maybe chop around a bit before again attempting to exceed 2016 highs, if it is to do so.
A drop below last week’s low will signal a continuation of the retracement. We can use Fibonacci ratio analysis to help determine potential support areas. The first price area to watch is the 38.2 per cent retracement at 3,479.85, followed by the 50 per cent at 3,427.05, and then the 61.8 per cent retracement at 3,372.40. Fibonacci analysis takes the prior trend, in this case the uptrend, and uses a calculation to determine where support might be encountered as price moves counter trend or retraces the previous advance.
Abu Dhabi
Last week the Abu Dhabi Securities Exchange General Index (ADI) dropped by 54.16 or 1.2 per cent to close at 4,462.99, its weakest performance in eight weeks. This follows last week’s 10-month top performance. Participation was mixed with 16 advancing issues and 15 declining, while volume fell to a seven-week low given the shortened four-day trading week.
The ADI initially rallied to 4,589.91 on Monday where it found resistance. That was in the upper zone of a multi-month rectangle consolidation pattern that goes up to the 2016 high of 4,637.24. At the same time last week’s high hit a trend line which has a slight downward slope as drawn across the top peaks of the consolidation pattern. A deeper retracement can now be anticipated given last week’s price behaviour and due to the fact that the 14-day RSI became slightly overbought at the high before turning down as the week progressed.
The first price area to watch for some support is around the 38.2 per cent Fibonacci retracement at 4,748.47, followed by the 50 per cent retracement at 4,795.30, and then the 61.8 per cent support zone at 4,843.77.
Stocks to watch
If the market continues to pull back and consolidate over the coming weeks then the opportuntites in individual issues will likely be limited. As of now there are no clear bullish chart pattern set-ups for the coming week’s, at least so far.
There is a small potential bearish head and shoulders top in Gulf Navigation that has formed right around support of the 21-day exponential moving average (ema). The stock has had a great run recently and is up 158.06 per cent this year. It’s the third best performing issue in the Dubai market. Last week it was down 0.62 per cent to close at 1.60.
A bearish trigger is indicated on a drop below 1.53. That would put the stock below the neckline of the head and shoulders pattern and back below its 21-day EMA for the first time since mid-October. If triggered a minimum downside target of 1.29 can be anticipated based on the measure of the pattern. Nevertheless, the first price area to watch for support following a breakdown is around 1.38. That’s where the 55-day EMA is currently located. The last key resistance zone of the most recent horizontal basing period is from around 1.21 to 1.18. If it gets that low it should present a good buying opportunity.
Bruce Powers, CMT, is chief technical analyst at www.MarketsToday.net. He is based in Dubai.