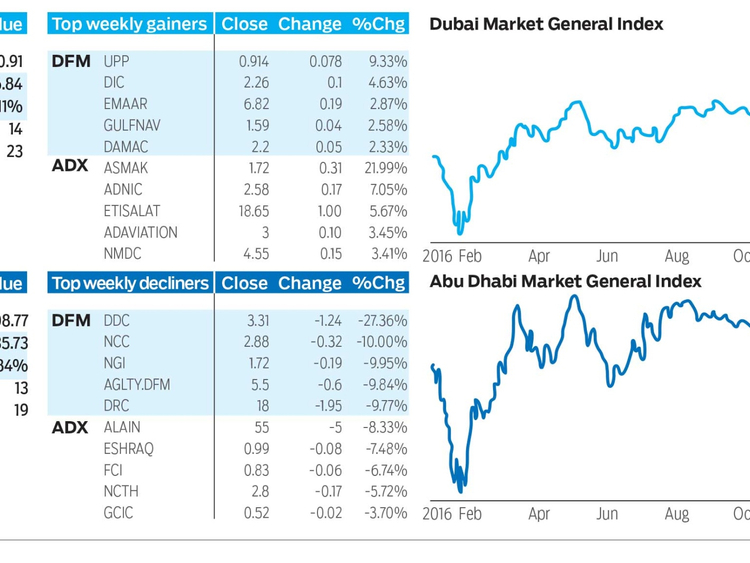
Dubai: The Dubai Financial Market General Index (DFMGI) advanced by 36.84 or 1.11 per cent last week to close at 3,360.91, its strongest performance in 15 weeks. Regardless, the majority of issues did not participate in the advance as there were 23 declining stocks and 14 that advanced. Volume fell to a three-week low but remained strong, in the upper band of the past seven months or so. That’s on a shortened four day trading week due to the UAE National Day holiday.
Although last week’s high (3,360.91, same as close) did not exceed the prior week’s high, which would have provided a bullish trend continuation signal, the week ended with the highest weekly close in nine weeks and at the high of the week. In addition, last week’s closing price was above the 200-day exponential moving average (ema) long-term trend indicator for the first time since late-September. Each of those indications, along with strong volume, point to a likely continuation of strength as the DFMGI moves into the third week of a recovery off the recent 3,195.49 swing low.
First, watch for a daily close above the two-week high of 3,368.06 for the next bullish signal. That would put the index at an eight-week high, and shortly thereafter back above its 21-week (ema), which is now at 3,373.80. In early October the DFMGI fell below the 21-week ema and it has represented a zone of resistance since.
Subsequently, the index will be targeting a potential resistance zone from approximately 3,428 to 3,474. Higher still is the 3,556 price area where resistance could be seen, followed by the 2016 peak at 3,623.70. Each of those price areas looks like it could put a halt to an advance. Regardless, given the large rectangle chart pattern that has been developing for much of this year, an eventual move back to the top of the pattern near the 2016 peak wouldn’t be unusual.
Last week’s low of 3,307.35 is near-term support. If violated to the downside a test of the recent swing low could be in the works.
Abu Dhabi
Last week the Abu Dhabi Securities Exchange General Index (ADI) increased by 35.73 or 0.84 per cent to close at 4,308.77. There 13 advancing issues and 19 declining, while volume dipped to a four-week low.
The ADI reached a three-week high before ending at a seven-week closing high. All of last week’s price action remains contained within a seven-week range (4,349.91 to 4,179.13) that has been forming near the bottom of the most recent steady decline from the July peak. This range represents investor uncertainty and sits around support of the 200-day ema (now at 4,226.41). It also shows continued downward pressure, as there has not yet been any clear sign of strength that could lead to a sustained rally. Therefore, the possibility of a continuation of the larger downtrend remains.
A continuation of the downtrend is signalled on a drop below the low end of the range and confirmed on a daily close below that price level. At that point a break below prior support will have occurred as well as a drop below support of the 200-day ema. Each is a bearish sign indicating the start of further weakness, not the end. The first downside target zone would start around 4,260.
The other possibility is that recent support continues to hold until price breaks out through the top of the seven-week range triggering a bullish signal. A daily close above 4,349.91 is needed to confirm this bullish scenario. Following an upside breakout the ADI would next be heading towards 4,458, followed by the 4,517 price area.
Stocks to watch
Emaar Properties closed at a five-week weekly closing high of 6.82 last week, up 2.87 per cent and the third best performer in Dubai. The stock has been in a descending trend channel since peaking at 7.46 in August, the 2016 high. Support of the decline is at 6.37, the low from three weeks ago. Last week’s advance occurred on 20-week low volume and shows that resistance to further price appreciation may be waning. Emaar closed strong, at the high for the week, and just at resistance of the downtrend line for the declining channel.
Next we want to see new signs of strength showing an increase in demand for the stock. The first sign will be on a decisive daily close above last week’s high. That will trigger a breakout of the downtrend line. Thereafter, a daily close above a prior swing high is needed. The more significant swing high is at 6.91, but a move above a lower and less distinct swing high of 6.78 can be used as a more aggressive bullish signal.
A daily close above 6.91 signals a reversal of the prior downtrend and also a breakout of a relatively deep double bottom trend reversal pattern. At that point the 2016 becomes a target and is more likely to be tested as resistance, with an increased possibility that Emaar might exceed that high.
On the downside, a support zone from around 6.57 to 6.54 should hold any weakness. If it does not the above bullish scenario becomes less likely in the near term.
Bruce Powers, CMT, is chief technical analyst at www.MarketsToday.net. He is based in Dubai.