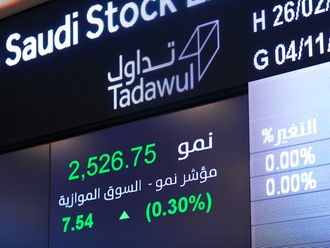
Dubai: The Dubai Financial Market General Index (DFMGI) was up 27.11 or 0.76 per cent last week to end at 3,591.10. There were 23 advancing issues and 15 declining, while volume was increased to a three-week high.
At the start of last week the bearish double top reversal pattern discussed in last week’s column was triggered, and there was a daily close below the prior weeks low thereby confirming the bearish implications of the decline. At that point it would not have been surprising to see the index continue to fall. Still, so far the bearish breakout has failed because the DFGMI spent the rest of the week going higher to end positive for the week.
We’ll ignore the possibility for another bearish trigger of the double top for now and focus instead on other developing patterns. Since the bulls were able to nab control from the bears relatively quickly last week following the downside trigger they may have strong enough conviction to either continue an expansion of the current consolidation zone or at least temper any near-term declines.
Let’s step back for a moment and look at the larger developing pattern that may be having greater influence on the DFMGI’s more recent swings than it looked previously. Nine weeks ago in early-August the index hit a peak around 3,681 that ended a nine-week rally off the early-June swing low. That was a strong rally that advanced the index as much as 12.8 per cent. Since then the DFMGI has pulled back over the past eight weeks with last week’s low of 3,538.03 the low of the decline so far. There’s a chance that the strength seen in that rally will show up again and create a second leg up from that June low.
Accelerated decline
So far the decline off the August high has not even retraced a third of the 12.8 per cent advance. This is a sign of strength for the intermediate-term trend. It’s possible that last week’s low is the end of the retracement, especially given the strength seen relative to the potential for an accelerated decline after the index broke down from the bearish double top and below the prior weeks low. We’ll know if its not if there is a drop below last week’s low.
Further supporting the possibility that the retracement is finished is the completion of a measured move that occurred last week. This is where the second leg down off the August peak matched the decline of the first leg down. When looking at the chart for the DFMGI there is the August high and then there is a second and lower swing high created four weeks ago. That second high is the start of the second leg down. The measured move is one way to identify where sustainable support might be found. In this case it identifies support of the retracement off the August high.
An advance above the two week high of 3,636 gives the next sign of strength and then the index will have to get over the four-week high of 3,667.42, followed by the August.
Abu Dhabi
The Abu Dhabi Securities Exchange General Index (ADI) advanced by 16.76 or 0.38 per cent last week to close at 4,414.16. Nonetheless, market breadth was bearish with 13 advancing issues against 19 declining. Meanwhile, volume dipped to a five-week low.
Although it tried to push lower the ADI managed to hold around support of the prior week’s low of 4,396.42. Last week’s low was 4,396.12. If the index breaks below that price level this week then it next heads to the potentially significant support zone around 4,358.36 to 4,355.26 (2017 lows). If not, then a rally could be forthcoming.
A breakout above last week’s 4,445.28 high gives the first bullish signal as that will end the five-week pattern of lower weekly highs. The next price zone of any significance looks to then be around the minor daily swing high of 4,483.74 followed 4,508.47, the five-week high. A daily close above the five-week high will be the bigger confidence builder as to whether the ADI can keep going higher from there.
Stocks to watch
Damac Properties was up 2.83 per cent last week on three-week high volume to close at 3.90. That’s a three-week high and shows the potential for the stock to continue to gain strength after almost three months of consolidation.
The consolidation was part of a retracement off the 4.57 peak from mid-July. That peak followed an approximately three-month advance of over 85 per cent. After such an aggressive move a pullback and rest is to be expected. Support around 3.71 was tested over four different weeks during the choppy sideways pattern, including last week. Now that Damac is moving away from that bottom price area buyers may be ready to take over again, as they were in the prior 85 per cent advance.
A move above last week’s high 3.94 gives the next bullish signal, followed by a rally above the most recent swing high of 4.04, and then the nine-week high of 4.14. The higher price level is of greater importance and if Damac could over it the chance for a test of the July peak and possible move above it increases.
Bruce Powers, CMT, is a technical analyst and global market strategist.


