Dubai
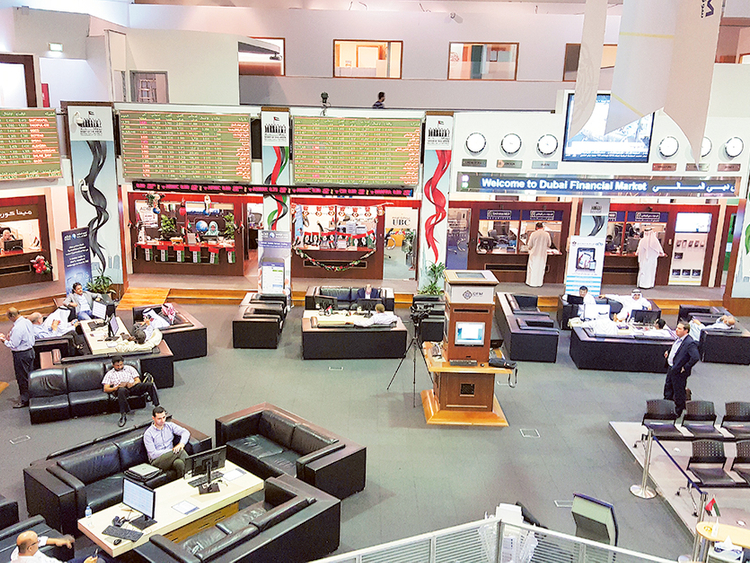
The Dubai Financial Market General Index (DFMGI) crept higher by 10.40 or 0.30 per cent last week to end at 3,460.21, its best performance in four weeks. Market breadth leant on the bullish side with 22 advancing issues and 16 declining, while volume was about flat with the previous week.
As noted last week, at the recent low of 3,397.92 hit two weeks ago the DFMGI had fallen 7.8 per cent from its most recent peak in January. The significance of that low was implied by the convergence of several indicators, including the completion of a double top target, the attainment of the 61.8 per cent Fibonacci retracement level, an extreme oversold reading on the Relative Strength Index (RSI) momentum oscillator (the lowest reading since the January 2016 bottom), and the positive reaction of price once the support zone was reached. This all points to the likelihood that the index would see a decent rally from the low.
So far, since hitting the low two weeks ago the DFMGI has advanced as much as 3.2 per cent, as of last week’s 3,504.99 high. Even though the week ended weak, in the lower quarter of the week’s range, there has only been one swing or leg up off the bottom so far. It seems safe to assume then that there could be a second leg up at a minimum, given how price generally patterns.
Also, the obvious next potential resistance zone of any significance is above last week’s high, up around prior support of 3,538. That’s at the neckline of the double top pattern and the 50 per cent retracement level of the most recent decline. Higher potential targets include the 61.8 per cent Fibonacci retracement level at 3,574.83, followed weekly resistance around the two-week high of 3,622.24.
On the downside, a drop below last week’s low should hold above the two-week low if the above short-term bullish scenario has a chance to occur. Therefore, weakness is likely to be met by buyers looking to enter stocks at lower prices. At the same time a drop below the two-week low is bearish and could lead to an acceleration to the downside, especially given that the Abu Dhabi market broke key long-term support last week, as discussed below.
Abu Dhabi
The Abu Dhabi Securities Exchange General Index (ADI) fell by 48.64 or 1.11 per cent last week to end at 4,327.58. There were 13 advancing issues and 21 declining, while volume moved lower from the previous week.
Last week’s decline triggered a breakdown of a large multi-month bearish descending triangle as the index fell below the prior 2017 low of 4,355.26 and closed below it on a weekly basis. The week’s closing price was at an eleven-month low. Given this renewed bearish signal the next potential support of note is not until down around the 2016 swing lows of 4,179 to 4,174. That narrow price zone can be combined with the 50 per cent retracement of the long-term uptrend (from January 2016 low) of 4,226 to arrive at a larger potential support zone from 4,226 to 4,174. Lower down is the minimum target derived from measuring the descending triangle, around 4,026.50.
Certainly, support might be seen before then but last week ended weak, near the bottom of the week’s range, signalling the likelihood of further selling. Even though last week was the fifth week in a row that the ADI declined, selling could even accelerate given the breakdown of the triangle. The caveat is that the index has now alien into a price range of prior consolidation from 2016 and that could slow the descent.
Near-term resistance is first around the prior 4,355 bottom, followed by last week’s high of 4,394.23.
Stocks to watch
There are two stocks that have some similar characteristics or soon will, within their charts. Both are bearish looking.
The first is Damac Properties. Last week Damac was up 0.28 per cent to close at 3.60, the first positive week out of the past four. Two weeks ago Damac broke down from a 16-week sideways consolidation top as it fell below 3.71 support and closed below it on a weekly basis. This was a bearish signal that usually will lead to still lower prices.
A drop below 3.49, last week’s low, gives the next bearish signal, with the downtrend confirmed on a decline below the two — week low of 3.39. The next key support zone is then around 2.97.
Next there is Dubai Islamic Bank, up 50 per cent last week to end at 6.02. It looks to have been forming a potential topping consolidation pattern over the past three months or so as it traded within a range from 6.26 to 5.96. Two week’s ago the low of that range was broken briefly before the stock recovered to close above the low on a daily basis. Subsequently, a mild bounce occurred off that low with Dubai Islamic bouncing to a 6.07 high last week.
At this point, a decisive drop below 5.94, two-week low, followed by a daily close below it confirms a breakdown of the multi-month consolidation pattern. Based on the size of the patten a target of at least 5.70 would then be possible.
Bruce Powers, CMT, is a technical analyst and global market strategist.


